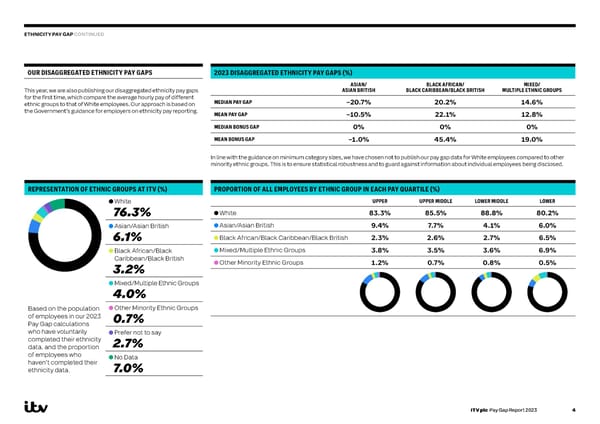
ETHNICITY PAY GAP CONTINUED OUR DISAGGREGATED ETHNICITY PAY GAPS 2023 DISAGGREGATED ETHNICITY PAY GAPS (%) ASIAN/ BLACK AFRICAN/ MIXED/ This year, we are also publishing our disaggregated ethnicity pay gaps ASIAN BRITISH BLACK CARIBBEAN/BLACK BRITISH MULTIPLE ETHNIC GROUPS for the first time, which compare the average hourly pay of different MEDIAN PAY GAP –20.7% 20.2% 14.6% ethnic groups to that of White employees. Our approach is based on the Government’s guidance for employers on ethnicity pay reporting. MEAN PAY GAP –10.5% 22.1% 12.8% MEDIAN BONUS GAP 0% 0% 0% MEAN BONUS GAP –1.0% 45.4% 19.0% In line with the guidance on minimum category sizes, we have chosen not to publish our pay gap data for White employees compared to other minority ethnic groups. This is to ensure statistical robustness and to guard against information about individual employees being disclosed. REPRESENTATION OF ETHNIC GROUPS AT ITV (%) PROPORTION OF ALL EMPLOYEES BY ETHNIC GROUP IN EACH PAY QUARTILE (%) White UPPER UPPER MIDDLE LOWER MIDDLE LOWER 76.3% White 83.3% 85.5% 88.8% 80.2% Asian/Asian British Asian/Asian British 9.4% 7.7% 4.1% 6.0% 6.1% Black African/Black Caribbean/Black British 2.3% 2.6% 2.7% 6.5% Black African/Black Mixed/Multiple Ethnic Groups 3.8% 3.5% 3.6% 6.9% Caribbean/Black British Other Minority Ethnic Groups 1.2% 0.7% 0.8% 0.5% 3.2% Mixed/Multiple Ethnic Groups 4.0% Based on the population Other Minority Ethnic Groups of employees in our 2023 0.7% Pay Gap calculations who have voluntarily Prefer not to say completed their ethnicity 2.7% data, and the proportion of employees who No Data haven’t completed their ethnicity data. 7.0% ITV plc Pay Gap Report 2023 4
 ITV 2023 Pay Gap Report Page 4 Page 6