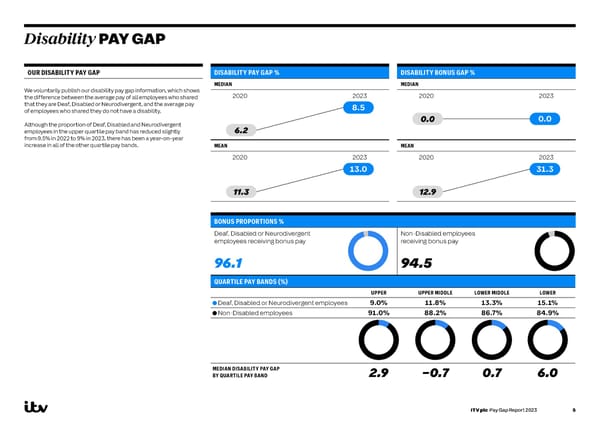
Disability PAY GAP OUR DISABILITY PAY GAP DISABILITY PAY GAP % DISABILITY BONUS GAP % MEDIAN MEDIAN We voluntarily publish our disability pay gap information, which shows 2020 2023 2020 2023 the difference between the average pay of all employees who shared that they are Deaf, Disabled or Neurodivergent, and the average pay 8.5 of employees who shared they do not have a disability. Although the proportion of Deaf, Disabled and Neurodivergent 0.0 0.0 employees in the upper quartile pay band has reduced slightly 6.2 from 9.5% in 2022 to 9% in 2023, there has been a year-on-year increase in all of the other quartile pay bands. MEAN MEAN 2020 2023 2020 2023 13.0 31.3 11.3 12.9 BONUS PROPORTIONS % Deaf, Disabled or Neurodivergent Non-Disabled employees employees receiving bonus pay receiving bonus pay 96.1 94.5 QUARTILE PAY BANDS (%) UPPER UPPER MIDDLE LOWER MIDDLE LOWER Deaf, Disabled or Neurodivergent employees 9.0% 11.8% 13.3% 15.1% Non-Disabled employees 91.0% 88.2% 86.7% 84.9% MEDIAN DISABILITY PAY GAP 2.9 –0.7 0.7 6.0 BY QUARTILE PAY BAND ITV plc Pay Gap Report 2023 5
 ITV 2023 Pay Gap Report Page 5 Page 7