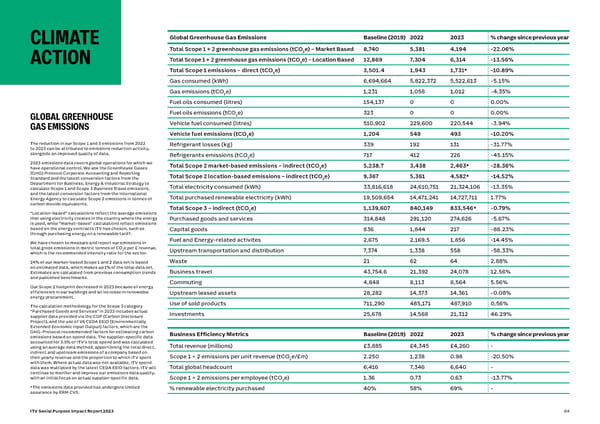
CLIMATE Global Greenhouse Gas Emissions Baseline (2019) 2022 2023 % change since previous year Total Scope 1 + 2 greenhouse gas emissions (tCO2e) – Market Based 8,740 5,381 4,194 -22.06% Total Scope 1 + 2 greenhouse gas emissions (tCO e) – Location Based 12,869 7,304 6,314 -13.56% ACTION 2 Total Scope 1 emissions – direct (tCO2e) 3,501.4 1,943 1,731* -10.89% Gas consumed (kWh) 6,694,664 5,822,372 5,522,613 ‑5.15% Gas emissions (tCO e) 1,231 1,058 1,012 ‑4.35% 2 Fuel oils consumed (litres) 154,137 0 0 0.00% Fuel oils emissions (tCO e) 323 0 0 0.00% GLOBAL GREENHOUSE 2 GAS EMISSIONS Vehicle fuel consumed (litres) 510,902 229,600 220,544 ‑3.94% Vehicle fuel emissions (tCO e) 1,204 549 493 -10.20% 2 The reduction in our Scope 1 and 3 emissions from 2022 Refrigerant losses (kg) 339 192 131 ‑31.77% to 2023 can be attributed to emissions reduction activity, alongside an improved quality of data. Refrigerants emissions (tCO e) 717 412 226 ‑45.15% 2 2023 emissions data covers global operations for which we Total Scope 2 market-based emissions – indirect (tCO e) 5,238.7 3,438 2,463* -28.36% have operational control. We use the Greenhouse Gases 2 (GHG) Protocol Corporate Accounting and Reporting Total Scope 2 location-based emissions – indirect (tCO e) 9,367 5,361 4,582* -14.52% Standard and the latest conversion factors from the 2 Department for Business, Energy & Industrial Strategy to Total electricity consumed (kWh) 33,816,618 24,610,751 21,324,106 ‑13.35% calculate Scope 1 and Scope 3 Business Travel emissions, and the latest conversion factors from the International Total purchased renewable electricity (kWh) 19,509,654 14,471,241 14,727,711 1.77% Energy Agency to calculate Scope 2 emissions in tonnes of carbon dioxide equivalents. Total Scope 3 – indirect (tCO e) 1,139,607 840,149 833,546* -0.79% “Location‑based” calculations reflect the average emissions 2 that using electricity creates in the country where the energy Purchased goods and services 314,848 291,120 274,626 ‑5.67% is used, while “market‑based” calculations reflect emissions based on the energy contracts ITV has chosen, such as Capital goods 836 1,844 217 ‑88.23% through purchasing energy on a renewable tariff. We have chosen to measure and report our emissions in Fuel and Energy‑related activites 2,675 2,169.5 1,856 ‑14.45% total gross emissions in metric tonnes of CO2e per £ revenue, Upstream transportation and distribution 7,374 1,338 558 ‑58.33% which is the recommended intensity ratio for the sector. 24% of our market‑based Scope 1 and 2 data set is based Waste 21 62 64 2.88% on estimated data, which makes up 1% of the total data set. Business travel 43,754.6 21,392 24,078 12.56% Estimates are calculated from previous consumption trends and published benchmarks. Commuting 4,848 8,113 8,564 5.56% Our Scope 2 footprint decreased in 2023 because of energy efficiencies in our buildings and an increase in renewable Upstream leased assets 28,282 14,373 14,361 ‑0.08% energy procurement. The calculation methodology for the Scope 3 category Use of sold products 711,290 485,171 487,910 0.56% “Purchased Goods and Services” in 2023 includes actual Investments 25,678 14,568 21,312 46.29% supplier data provided via the CDP (Carbon Disclosure Project), and the use of V6 CEDA EEIO (Environmentally Extended Economic Input Output) factors, which are the GHG‑Protocol recommended factors for estimating carbon Business Efficiency Metrics Baseline (2019) 2022 2023 % change since previous year emissions based on spend data. The supplier‑specific data accounted for 3.5% of ITV’s total spend and was calculated Total revenue (millions) £3,885 £4,345 £4,260 ‑ using an average data method, apportioning the total direct, indirect and upstream emissions of a company based on Scope 1 + 2 emissions per unit revenue (tCO e/£m) 2.250 1.238 0.98 ‑20.50% their yearly revenue and the proportion to which ITV spent 2 with them. Where actual data was not available, ITV spend Total global headcount 6,416 7,346 6,640 ‑ data was multiplied by the latest CEDA EEIO factors. ITV will continue to monitor and improve our emissions data quality, with an initial focus on actual supplier‑specific data. Scope 1 + 2 emissions per employee (tCO2e) 1.36 0.73 0.63 ‑13.77% *The emissions data provided has undergone limited % renewable electricity purchased 40% 58% 69% ‑ assurance by ERM CVS. ITV Social Purpose Impact Report 2023 64
 ITV Social Purpose Impact Report 2023 Page 63 Page 65