
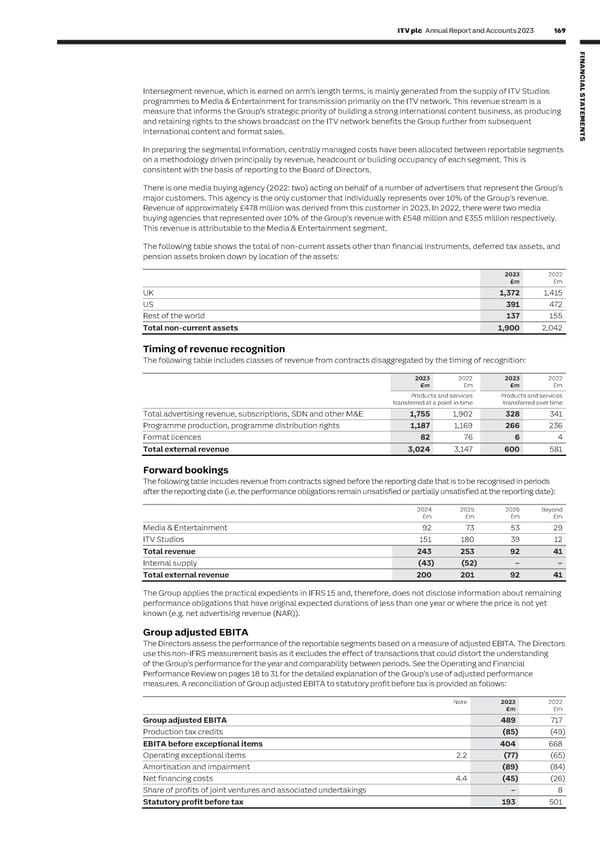
168 ITV plc Annual Report and Accounts 2023 ITV plc Annual Report and Accounts 2023 169 F I NOTES TO THE FINANCIAL STATEMENTS NAN SECTION 2: RESULTS FOR THE YEAR CONTINUED C I AL The results for the year aggregate these classes of revenue into the following categories: Intersegment revenue, which is earned on arm’s length terms, is mainly generated from the supply of ITV Studios S T programmes to Media & Entertainment for transmission primarily on the ITV network. This revenue stream is a A T 2023 2023 2022 2022 measure that informs the Group’s strategic priority of building a strong international content business, as producing E £m % of total £m % of total M and retaining rights to the shows broadcast on the ITV network benefits the Group further from subsequent E ITV Studios UK 962 822 N international content and format sales. T ITV Studios US 395 467 S ITV Studios International 445 465 In preparing the segmental information, centrally managed costs have been allocated between reportable segments * on a methodology driven principally by revenue, headcount or building occupancy of each segment. This is Global Partnerships 368 342 Total ITV Studios** 2,170 51% 2,096 48% consistent with the basis of reporting to the Board of Directors. There is one media buying agency (2022: two) acting on behalf of a number of advertisers that represent the Group’s Total advertising revenue (TAR) 1,778 42% 1,931 44% major customers. This agency is the only customer that individually represents over 10% of the Group’s revenue. Subscriptions 59 54 Revenue of approximately £478 million was derived from this customer in 2023. In 2022, there were two media SDN 48 55 buying agencies that represented over 10% of the Group’s revenue with £548 million and £355 million respectively. Partnerships and other revenue 205 209 This revenue is attributable to the Media & Entertainment segment. Media & Entertainment 2,090 49% 2,249 52% The following table shows the total of non-current assets other than financial instruments, deferred tax assets, and *** pension assets broken down by location of the assets: Total revenue 4,260 4,345 * Global Formats and Distribution was rebranded as Global Partnerships in the year 2023 2022 ** ITV Studios UK, ITV Studios US and Studios International revenues are mainly programme production. Global Partnerships revenue is from programme £m £m distribution rights, format licences and gaming, live events and merchandising. *** Includes internal supply as discussed in the APMs (page 43). UK 1,372 1,415 Digital revenues of £490 million (2022: £411 million) include digital advertising revenue and subscription revenue, US 391 472 digital sponsorship and partnership revenue, ITV Win and other revenues from digital business ventures. Rest of the world 137 155 Total non-current assets 1,900 2,042 Segmental information Operating segments, which have not been aggregated, are determined in a manner that is consistent with how the Timing of revenue recognition business is managed and reported to the Management Board. The Management Board is regarded as the chief The following table includes classes of revenue from contracts disaggregated by the timing of recognition: operating decision-maker and considers the business, primarily from an operating activity perspective. 2023 2022 2023 2022 The Groups' segments are Media & Entertainment and ITV Studios, the results of which are outlined in the following tables: £m £m £m £m Products and services Products and services Media & transferred at a point in time transferred over time ITV Studios* Entertainment Consolidated Total advertising revenue, subscriptions, SDN and other M&E 1,755 1,902 328 341 2023 2023 2023 £m £m £m Programme production, programme distribution rights 1,187 1,169 266 236 Total segment revenue 2,170 2,090 4,260 Format licences 82 76 6 4 Intersegment revenue (629) (7) (636) Total external revenue 3,024 3,147 600 581 Revenue from external customers 1,541 2,083 3,624 Forward bookings Adjusted EBITA** 286 205 491 The following table includes revenue from contracts signed before the reporting date that is to be recognised in periods Unrealised profit in stock adjustment (2) after the reporting date (i.e. the performance obligations remain unsatisfied or partially unsatisfied at the reporting date): *** 2024 2025 2026 Beyond Group adjusted EBITA 489 £m £m £m £m Media & Media & Entertainment 92 73 53 29 ITV Studios* Entertainment Consolidated ITV Studios 151 180 39 12 2022 2022 2022 £m £m £m Total revenue 243 253 92 41 Total segment revenue 2,096 2,249 4,345 Internal supply (43) (52) – – Intersegment revenue (611) (6) (617) Total external revenue 200 201 92 41 Revenue from external customers 1,485 2,243 3,728 The Group applies the practical expedients in IFRS 15 and, therefore, does not disclose information about remaining performance obligations that have original expected durations of less than one year or where the price is not yet Adjusted EBITA** 259 464 723 known (e.g. net advertising revenue (NAR)). Unrealised profit in stock adjustment (6) Group adjusted EBITA*** 717 Group adjusted EBITA The Directors assess the performance of the reportable segments based on a measure of adjusted EBITA. The Directors * Intersegment revenue originates mainly in the UK. use this non-IFRS measurement basis as it excludes the effect of transactions that could distort the understanding ** Adjusted EBITA is EBITA adjusted to exclude exceptional items and includes the benefit of production tax credits. It is stated after the elimination of intersegment revenue and costs. of the Group’s performance for the year and comparability between periods. See the Operating and Financial *** Group adjusted EBITA removes the profit recorded in the ITV Studios business related to content sold to the Media & Entertainment business but Performance Review on pages 18 to 31 for the detailed explanation of the Group’s use of adjusted performance unutilised and held on the balance sheet at the year end. A reconciliation of Group adjusted EBITA to statutory profit before tax is provided on page 43. measures. A reconciliation of Group adjusted EBITA to statutory profit before tax is provided as follows: The Group’s principal operations are in the United Kingdom. Revenue from external customers in the United Kingdom is £2,272 million (2022: £2,376 million) and revenue from external customers in other countries is £1,352 million Note 2023 2022 £m £m (2022: £1,352 million), of which revenue of £641 million (2022: £655 million) was generated in the US during the year. Group adjusted EBITA 489 717 The Operating and Financial Performance Review provides further detail on ITV’s international revenues. Production tax credits (85) (49) EBITA before exceptional items 404 668 Operating exceptional items 2.2 (77) (65) Amortisation and impairment (89) (84) Net financing costs 4.4 (45) (26) Share of profits of joint ventures and associated undertakings – 8 Statutory profit before tax 193 501
 ITV Annual Report & Accounts Page 170 Page 172